Detailed description of the project
In recent decades, the concept of the social network has gained wider currency among various disciplines and areas of research. Social network analysis collects and describes patterns of relationships and support among individuals, employing concepts drawn from graph theory.
Generally, data of contact partners within a personal (ego-)network are collected with the help of network questionnaires and then evaluated by means of quantitative analysing software: Collecting and analysing these data (number, density, centrality of relationships) has so far been carried out by means of a highly standardised method requiring considerable effort and qualified research staff. Consequently, these methods are hardly applicable in user-oriented areas and remain, owing to their purely quantitative character, ultimately bound to a perspective solely stemming from an external view. As of late, there have been endeavours to develop methods that come “closer to the actors, their perceptions, interpretations and structures of relevance” (Hollstein 2006: 13, translated from the German).
Almost all of these approaches towards a qualitative or “actor-centered network analysis”, which have only just been established, draw on the “social convoy” model as developed by Robert Kahn and Toni Antonucci in 1980 for displaying social support structures. Because of their simple structure and the selective way in which the data are collected, these models are limited in terms of informative value and empirical validity and are therefore not uncontested (Diaz-Bone 2007). A branch within organisational research and consulting has emerged in recent years which visualises views of organisation members in a common process and uses them as an additional template for analysis and interpretation. While these techniques are successfully applied in consulting and development aid processes both nationally and internationally, they either come under criticism from academic circles due to their being neither replicable nor representative, or they simply go unnoticed.
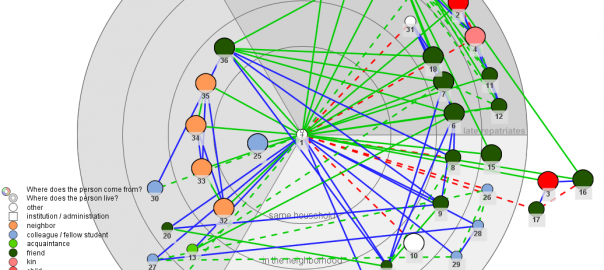
The aim of the transdisciplinary research group is to develop a software tool which enables the user to interactively collect network relationships from an actor’s point of view and render them comparable and quantitatively analysable by means of a graphical user interface that can be operated intuitively. The crucial point about this approach is that test persons are able to visualise and qualitatively evaluate their own networks themselves while simultaneously reflecting with the researcher in retrospect and considering desirable alterations. At the same time, the entire procedure and the results are digitally recorded and may be further processed and validated. The tool could thus be used for both research and consulting purposes. From the vantage point of the social sciences, the hitherto missing link between quantitative and qualitative network analysis has been established in this way. There have been many developments in this area; to our knowledge, however, there is no project which has solved the complexity problem and the issue of availability of qualitative and quantitative data so far.
The development of VennMaker within the cluster of excellence draws on long standing experience in the development and application of participatory research methodology (Schoenhuth 1995, 1998, 2003, 2007), in visual data mining and graph drawing (Pohl et al. 2004, 2006, 2007) as on the professional experience of various other disciplines within the participating universities Trier and Mainz, thereby broadening traditional network research with an innovative and unique methodological tool.
